
Spectrum Analysers
Is your Hi-res download true Hi-res or just a up-sampled CD?
Spectrum analyzers will tell you if there is life above 20 kHz.
MusicScope
Unfortunately Xivero closed down early 2020. The software was avaiable at SourceForge but per 2022 it was removed. You might try the web archive.
Source: XiVero Audio Tools - roblog
All freeware versions taken from sourceforge can be found here.
XiVero GmbH have officially closed their doors - Hydrogen audio

Supports WAV, FLAC, AIFF, ALAC, DSF, DFF from 1Bit to 24Bit with sampling rates between 44.1 and 384 kHz and DSD64 / DSD128 (resampled to PCM).
Features
TPM: True Peak Meter
RMS: (Root Mean Square) 400 ms averaged RMS
CREST: Indicates the amount of dynamic compression
Loudness (according to the standards EBU R128 and ITU-R BS-1770)
M = Momentary = 400 ms
S = Short Term = 3 s
I = Integrated = Averaged over the whole music track
LRA = Loudness Range produced by the music track
Linear Frequency Spectrum: the frequencies in the recording.
Spectrogram: the spectrum over time.

A nice example, a 24 bit 192 kHz file but obvious no life above 22 kHz or below -96 dBFS.
This is a typical case of an up-sampled CD.
 A true 24/176 recording.
Frequencies close to ½ fs (176/2=88) and down to approximately -110 dB.
 A DSD64 file.
Typical DSD is the enormous amount of quantization noise starting at 22 kHz.

A DSD64 converted to PCM by JRiver.
Understandably there is a filter used in the conversion process to get rid of the quantazation noise.
At 77 kHz the level is -144 dBFS.
Mathematical spoken, the entire conversion by JRiver will be preserved if you convert to PCM using a 176 kHz sample rate.
 A 24 bit / 192 kHz file with a lot of high frequency noise.
Notice the blue bands in the spectrogram.
Makes me wonder what the source is.

A 24/88 piano recording with a noise floor around -100 dBFS
 A 24 / 192 recording by BIS.
Some weird peaks between 50 and 60kHz. As we can't hear above 20 kHz it is inconsequential.
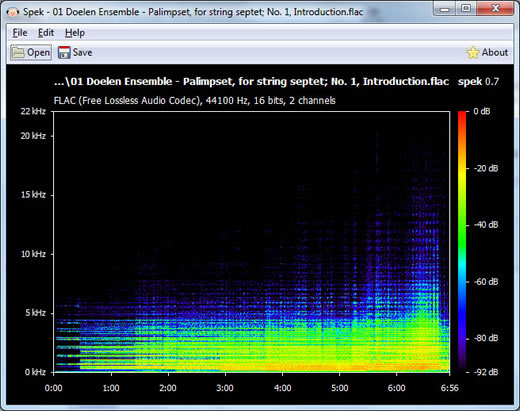
Spek – Acoustic Spectrum Analyser
- Supports all popular lossy and lossless audio file formats thanks to the FFmpeg libraries.
- Ultra-fast signal processing, uses multiple threads to further speed up the analysis.
- High number of frequency bands for the best spectrogram quality.
- Shows the codec name and the audio signal parameters.
- Allows to save the spectrogram as an image file.
- Drag-and-drop support; associates with common audio file formats.
- Auto-fitting time, frequency and spectral density rulers.
- Available in Dutch, English, French, German, Polish, Russian, Spanish, Swedish and Ukrainian.
Sonic Visualiser
Sonic Visualiser is an application for viewing and analysing the contents of music audio files.
We hope Sonic Visualiser will be of particular interest to musicologists, archivists, signal-processing researchers and anyone else looking for a friendly way to take a look at what lies inside the audio file.
Sonic Visualiser is Free Software, distributed under the GNU General Public License (v2 or later) and available for Linux, OS/X, and Windows. It was developed at the Centre for Digital Music at Queen Mary, University of London.
Source: Centre for Digital Music, Queen Mary, University of London.
